Dashboard Demo
The AONES dashboard has pages that show detailed information related to drug alerts and drug confiscations for different regions in North America. There are also pages that allow for further analysis into the themes of the articles or to search all articles collected in the past 90 days. Below there are instructions on how to use features common on all pages, and then specific instructions for features on individual pages.
For a short video demo on how to use the dashboard, please click here.
Please note that the dashboard works best on a desktop. Some of the features of the dashboard might not work on mobile devices.
General features
The AONES dashboard has different sections for different use cases:
- seeing recent alerts (1 page),
- tracking drug confiscations (1 page),
- looking at recent themes in the drug supply (4 pages), and
- exploring the full dataset (1 page).
There are multiple ways to navigate between the sections and the individual pages.
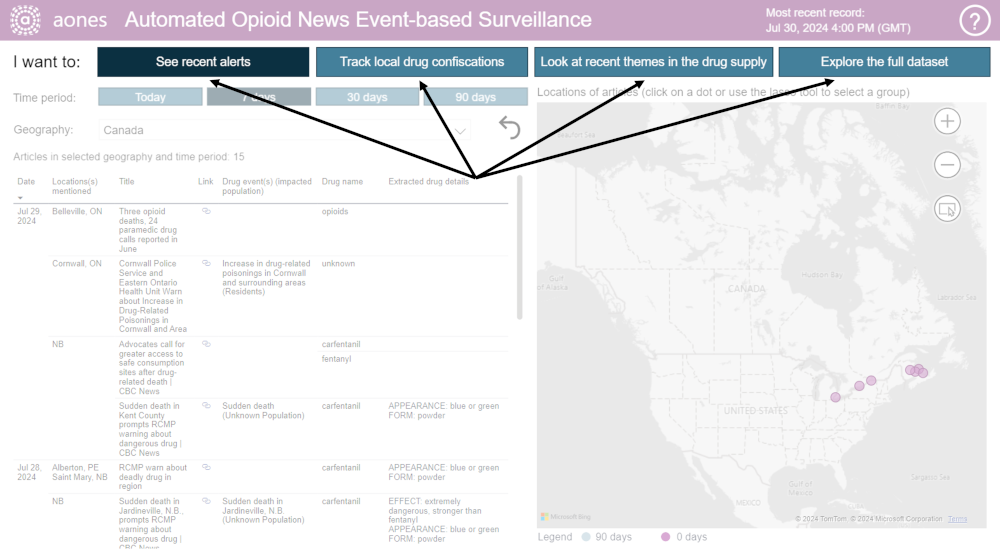
You can switch between sections (use cases) using the navigation bar at the top of each dashboard page by clicking on the different headers next to “I want to:”.
For uses cases with multiple pages, you can go to the individual pages by using the sub-headers underneath the main “I want to” header.

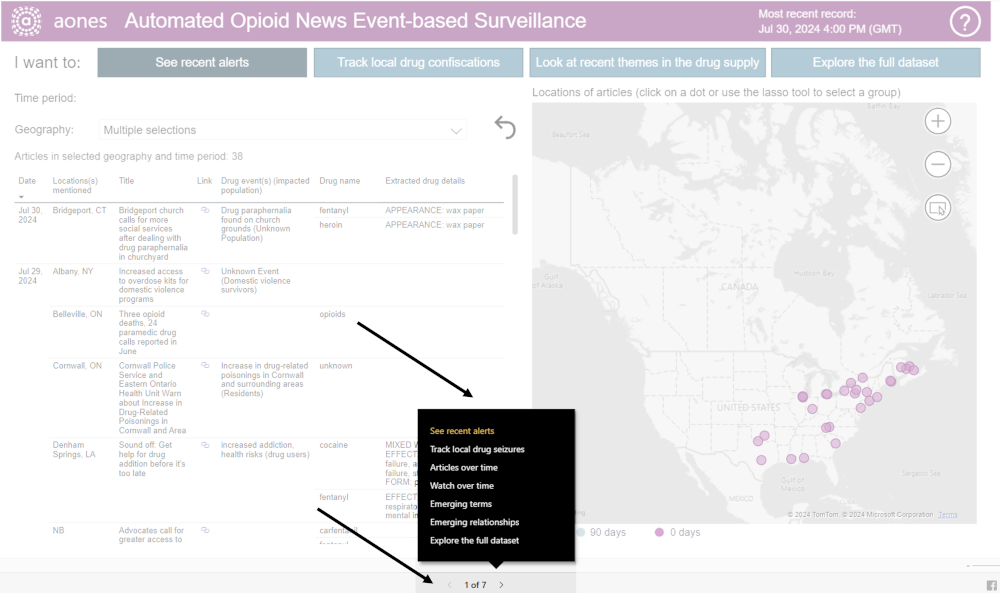
You can navigate to individual pages directly by using the navigation bar at the bottom. You can click on the arrows to go page by page. To choose a specific page, first click on the numbers (e.g., 1 of 7) and then click on the page title in the pop-up.
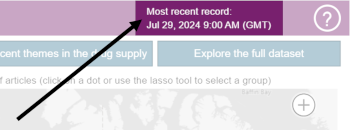
The top right corner shows the most recent successful extraction of data. While the original data feed is updated hourly, the dashboard is updated every 3 hours. In general, the time reflects the last time an article in scope was found (i.e., it won’t update if there are no new articles). However, if there are errors in the data processing pipeline, this field will not be updated. Time is based on GMT (Greenwich Mean Time) zone.
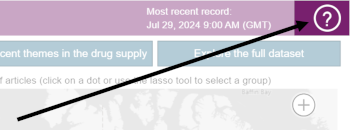
At the top right there is a help button (a question mark). If you click this button, you will be brought to the main webpage for AONES.
Clicking on the URL links in tables will redirect you to the full text of the article. Opening the URLs is at your own risk and they may no longer exist.
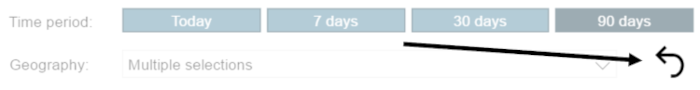
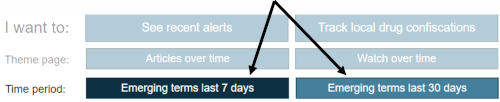
Most pages have filters to specify the time range of the articles included. The ‘See recent alerts’ and ‘Track local drug confiscations’ pages have preset date filters below the main headers. These filter the page to show only articles from today, or the last 7, 30 or 90 days. Click on the button to change the time range. The pages default to showing data from the last 7 days.

Other pages use a time range filter that allows you to choose a custom time range from 90 days ago to today. You can use either the calendar picker (by clicking on the dates themselves) or by using the two sides of the scroll bar.
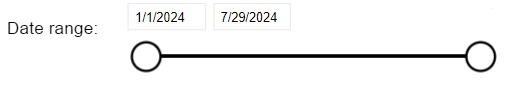
All dates and times are based on Greenwich Mean Time (GMT) and reflect the date and time the article appeared on GDELT.
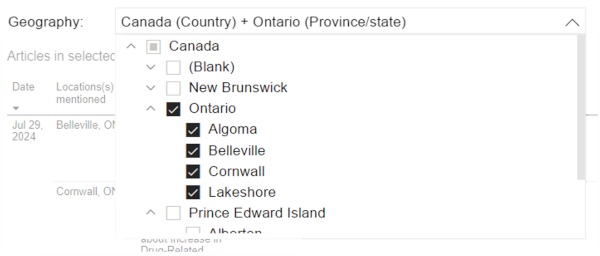
Data is available in the dashboard by country, province/state and city/municipality. Only articles mentioning locations in Canada and the United States are included. Depending on the page, geography filters are available both as a dropdown and as a map. By default, pages are filtered to only show Canadian articles.
Click on the arrow in the dropdown filter to see options. The dropdown is organized by country, then province/state, then city/municipality. Click on the arrows next to a higher level to see all the options within. As the list gets longer, scroll down to see all the choices. You can choose any combination of options, including across different levels of geography. Choosing a country or province/state will include all the lower level geographies underneath it. Only geographies that have articles in the dashboard will show on the list (after the other filters on the page are applied). Selecting nothing is the same as selecting everything.
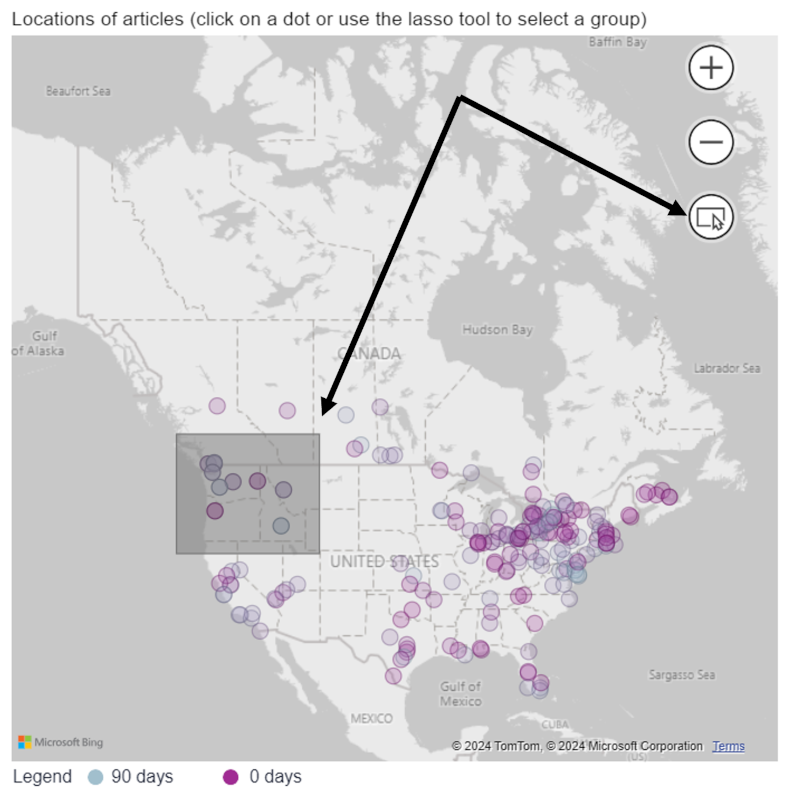
Maps can also be used as temporary filters. They have a Rectangular Select (also known as the lasso tool) button that allows for selection of data points with the defined shape. After clicking on the button, you can click on the map and drag horizontally, vertically and diagonally to capture all points in the geographical area of interest. These selected datapoints will then filter the other visuals on the page. If you click on other specific items on other visuals (e.g., a row or cell in a table), this filter will disappear. The filter will remain if you click on other filters. All maps have zoom in buttons indicated by the + and – buttons. You can also drag the map with your cursor to view the geographical location of interest.
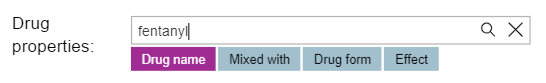
Several pages have an open-ended search box allowing you to search for specific drug names (or other drug properties) by typing in the term. This is indicated by a white box with grey text saying Search and a magnifying glass and X icons. After typing in your search term, click the magnifying glass or hit ‘Enter’. Selecting the X icon allows you to reset filters.
If the search box has buttons underneath, you can search by one of those properties (drug name, mixed with, drug form and effect). Click the button you are interested in before typing in your search term. The search term will apply to whatever button is active (in purple).
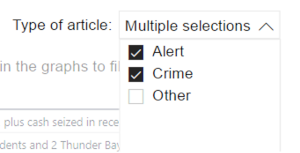
Some pages also have a dropdown filter allowing you to select the type of article (alert, crime or other). You can select one or more options.
To learn more about the types of articles of types of drug properties included in the tool, go to the AONES data pipeline page.
Most pages have a curved arrow button that clears all filters on the page. If you click this button, the page will return to the default filters for the page.
Use cases (dashboard pages)
The following sections describe the purpose of each dashboard page, the type of information available on them, and how to use interact with the page, especially any unique visuals on the page.
This page includes the most current dashboard articles that have been categorized as drug alerts. This category is meant to capture articles related to sudden spikes of opioid events. Given the nature of AI, articles that do not fit these criteria may also be included. The page’s purpose is to filter to a small number of articles to provide a quick and central place to identify events happening in the drug supply across the continent or in your local region.
Articles and the data extracted from them are presented in two ways: in a table and on a map.
The table contains the main fields related to the drug event and a synthesis of the drug property fields. Specifically, it includes:
- The date the article was identified by GDELT (this may not be the date the article was originally posted).
- A list of any locations mentioned in the article (reported as city, province/state).*
- The original title of article.
- A link to the original article.
- A few word description of the drug event(s) with any information about the impacted population provided in brackets.*
- The drug name.*
- A synthesis of any known drug details (any drugs/contaminants the drug is mixed with, the effect of the drug, it’s appearance, it’s form, and any information about it’s prevalence).*
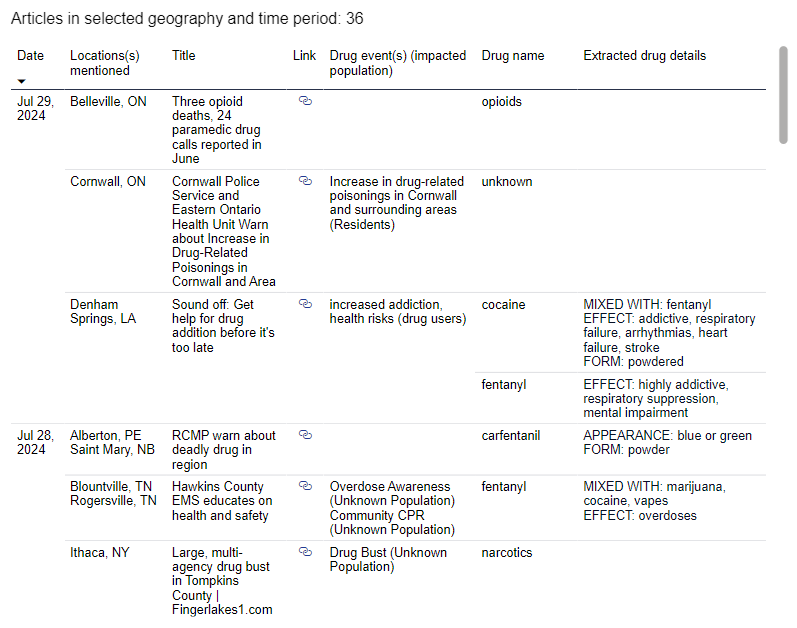
The table is sorted to show the most recent articles first. Above the table, the total number of articles meeting the current filter criteria is shown. You can click on individual cells within the table to temporarily filter the map.
The map shows individual data points for each location mentioned in the articles meeting current filter criteria. Locations are always shown at the city/municipality level. The colour of the data points indicates how old the most recent article from that location is (purple most recent and blue oldest). If you hover over a data point, a detailed tool tip will appear. The tooltip will provide:
- The location of the data point (city/municipality and province/state).*
- The number of articles at that location within the selected time range.
- The most recent and earliest dates of articles for that location within the time range.
- A list of drug events extracted from the articles mentioning that location.*
- A list of drug names extracted from the articles mentioning that location.*
- A list of other locations mentioned in articles mentioning that location (this can be helpful to identify if a region with several data points is all due a single article mentioning multiple related locations).*
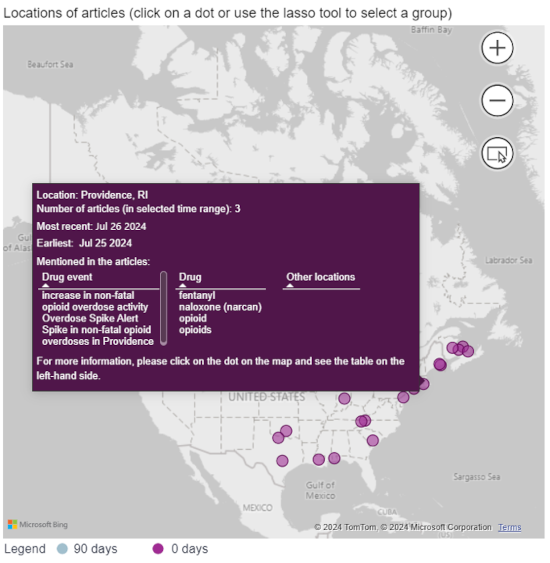
You can click on the data point to filter the table to only articles from that location to see more information about the articles and to access links to the original articles.
Filters are available on this page for preset time ranges and for geography. Please see the filters section on this page for instructions on how to use them. The page defaults to showing articles from Canada and the last 7 days.
This page includes recent dashboard articles discussing drug seizures and confiscations. Given the nature of AI, articles that do not fit these criteria may also be included. The purpose of this page is to provide an overview of the types of drugs (and any other known information about them) that are being confiscated locally or across broader regions to provide insight into what drugs might be circulating in the drug supply.
Articles and the data extracted from them are presented in two ways: in a table and on a map.
The table contains the drug properties; specifically, it includes:
- The date the article was identified by GDELT (this may not be the date the article was originally posted).
- A link to the original article.
- A list of any locations mentioned in the article (reported as city, province/state).*
- The drug name.*
- The form of the drug (e.g., pill, powder).*
- Any other drugs or contaminants the drug may have been mixed with.*
- The appearance of the drug (e.g., its colour, any symbols or writing).*
- The quantity of the drug seized (often in weight or number of pills).*
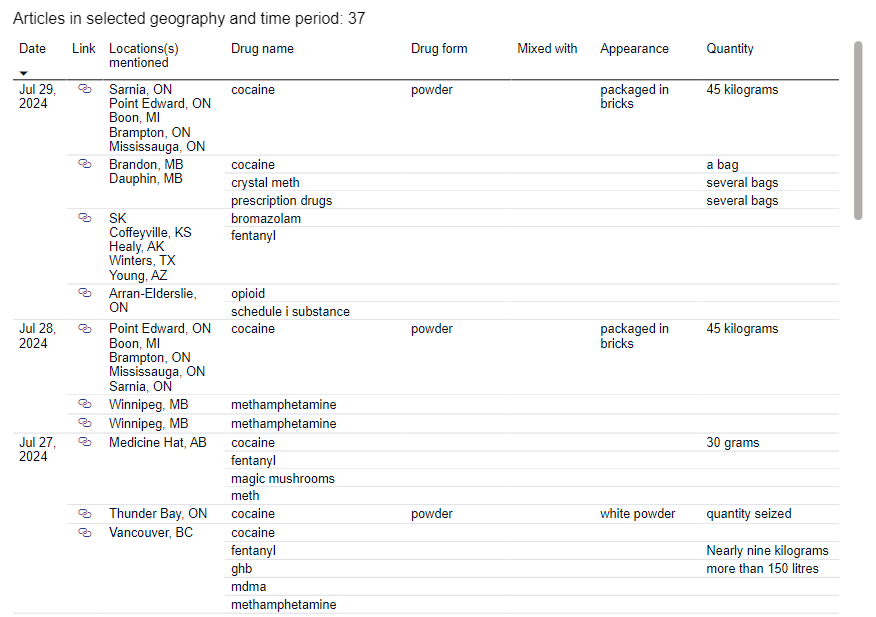
The table is sorted to show the most recent articles first. Above the table, the total number of articles meeting the current filter criteria is shown. You can click on individual cells within the table to temporarily filter the map. Information about multiple drugs confiscated may be extracted from each article – in this case each drug will have its own line in the table (starting with drug name).
The map shows individual data points for each location mentioned in the articles meeting current filter criteria. Locations are shown at the city/municipality level. The colour of the data points indicates how old the most recent article from that location is (purple most recent and blue oldest). If you hover over a data point, a detailed tool tip will appear. The tooltip will provide:
- The location of the data point (city/municipality and province/state).*
- The number of articles at that location within the selected time range.
- The most recent and earliest dates of articles for that location within the time range.
- A list of drug names extracted from the articles mentioning that location.*
- A list of other locations mentioned in articles mentioning that location (this can be helpful to identify if a region with several data points is all due a single article mentioning multiple related locations).*
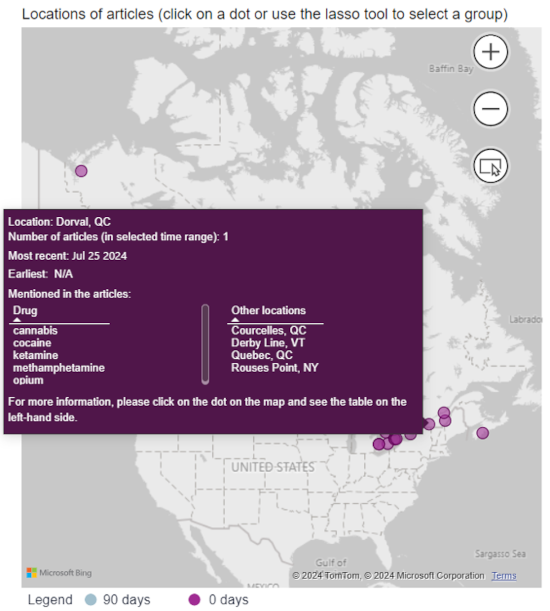
You can click on the data point to filter the table to only articles from that location to see more information about the articles and to access links to the original articles.
Filters are available on this page for preset time ranges, geography and drug name. Please see the filters section on this page for instructions on how to use them. The page defaults to showing articles from Canada and the last 7 days.
There are four pages which use different methods and visualizations to provide insight into the themes found in the data over time and space.
This page includes graphs showing the number of articles over time by article type: alert, crime (aka drug confiscations), and other (other articles that may contain relevant information but do not fall into the two primary categories). The purpose of this page is to allow you to look at trends overall and in individual terms over time (by using the drug properties filter).
Two different indicators are used in the area graphs: the number of articles by day and the number of distinct locations by day. It is expected that these graphs will show similar patterns, but each indicator has limitations, so both are provided. Given the nature of the data source (media articles), the same event may be captured by multiple articles inflating the number of articles per day. In this scenario, the number of distinct locations should be more normalized (aka only count each event once). However, some articles mention multiple locations, sometimes within a small region, which can inflate this indicator.
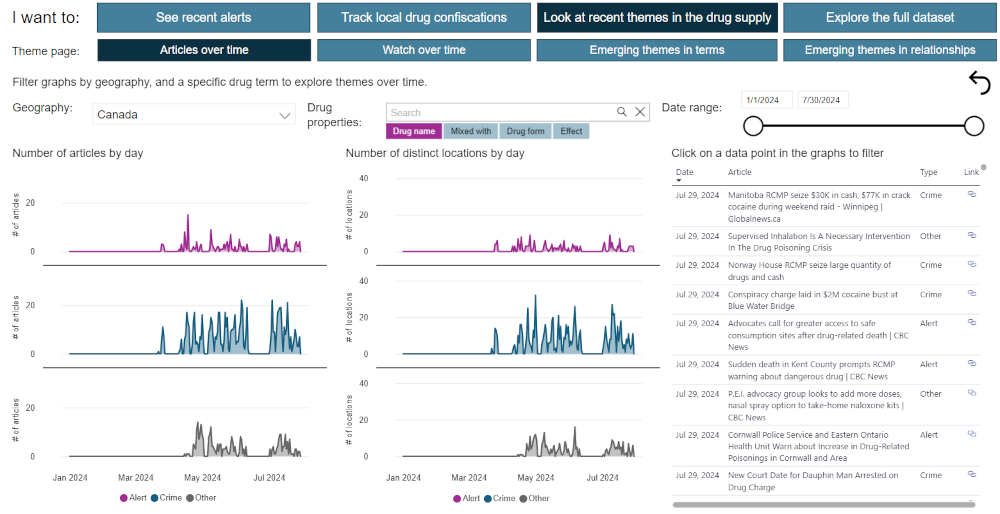
In addition to the graphs, there is a table of articles on the right-hand side. When you have clicked on a specific data point in the graphs, the articles in this table will filter. It provides you with the titles of the articles being included and the link to the original article to verify the content.
Filters are available on this page for custom date ranges, geography and drug properties. Please see the filters section on this page for instructions on how to use them. The page defaults to showing all articles from Canada and the last 180 days.
This page provides a time lapse of articles on a map. The purpose of this page is to show the geographic movement over time of articles or specific terms (by using the drug properties filter).
To watch the data points appear over time (by day), use the play button near the top left corner. The time lapse can be paused, stopped or manually increased day by day using the other buttons. Data points will also change colour based on the legend as time goes by (purple most recent to blue oldest). The map also contains the full tooltip from the ‘See recent alerts’ page.
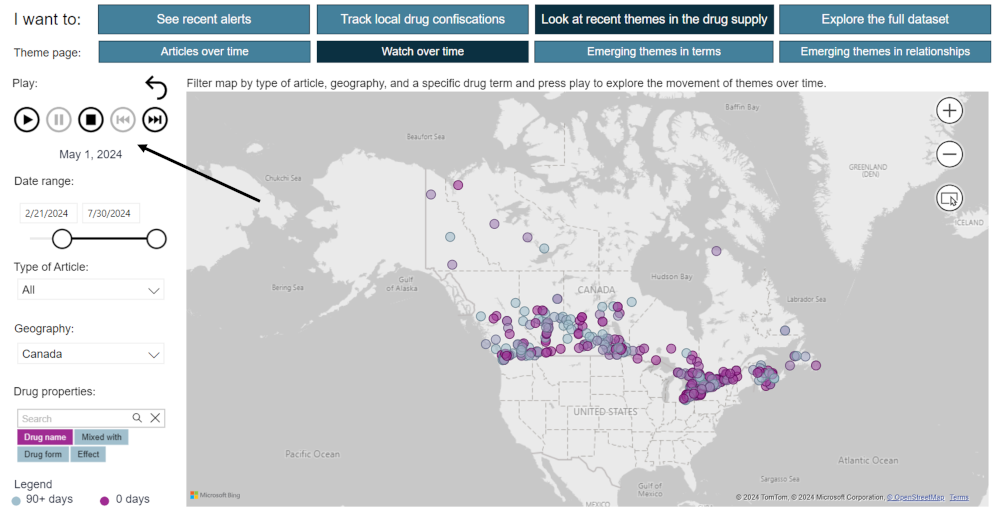
Filters are available on this page for custom date ranges, geography, type of article and drug properties. Please see the filters section on this page for instructions on how to use them. The page defaults to showing all articles from Canada and the last 90 days.
There are 2 pages containing visuals surfacing concepts that have appeared more frequently recently than they did previously: one for each of the individual terms (each of the main drug properties by themselves), and for the relationships between drug properties. The purpose of this page is to highlight potentially emerging themes in the drug supply (with an understanding of the limitations of both the data source and the AI extraction). On each page, two options are available: emerging themes from the past 7 days or emerging themes from the past 30 days.
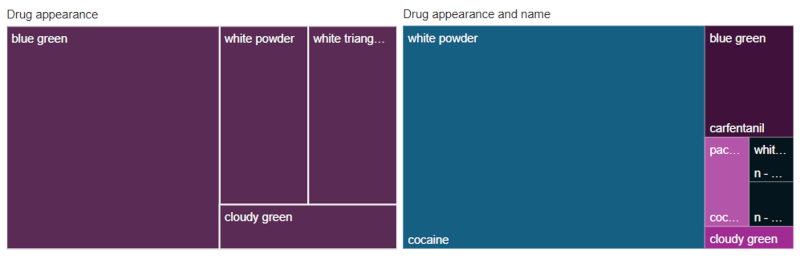
On the emerging terms page, visuals are provided for each of: drug name (and mixed with), drug form, drug appearance and drug effect. Because of the nature of the AI extraction, drug names can inconsistently appear in either the drug name field or the mixed with field and so for the purpose of this visual the list has been merged. On the emerging relationships page, the relationships shown are between drug name and each of form, appearance and effect. Additionally, the combinations of drug names (and mixed with) within articles are shown.
Most of the data is displayed in visuals called tree maps. In these, the larger the box the more frequently the term/relationship has appeared in the time frame (past 7 or 30 days). For emerging terms, the term is displayed in the top left corner of the box (if it fits). Otherwise, you can hover over the box to see the term. For emerging relationships, the drug property (form, appearance or effect) is shown in the top left corner and the drug name in the bottom left corner. Again, you can hover over the boxes to see the terms as well. For the relationships page, the colour coding shows the same drug property (e.g., all powder boxes are one colour and all pill boxes are another).
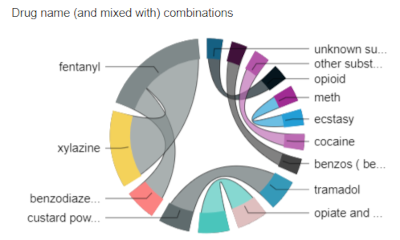
A different visual is used to show the combinations of drugs (and mixed with). All the drugs listed along the outside of the circle are the individual drugs, with the size of the arc reflecting the frequency it appears. The connecting bars show the combinations between the drugs, with the width of the bars reflecting the frequency the combination appears.
The point of this page is to highlight emerging terms/relationships. For the dashboard this is defined as articles that appear more in the past 7 days than they did in the previous 8-30 days, or more in the past 30 days than they did in the previous 31-90 days. Specifically, terms/relationships are only included in the visuals if the percentage of articles they appear in in the current time frame (7 or 30 days) is greater than the percentage of articles they appear in the comparison time frame.
In addition to the visuals, there is a table of articles on the right-hand side. When you have clicked on a specific data point in the visual, the articles in this will filter. This provides you with the titles of the related articles and their link to verify the content.
Filters are available on this page for geography and type of article. Please see the filters section on this page for instructions on how to use them. The page defaults to showing all articles from Canada.
The final page provides a full listing of all articles captured in the dashboard in the past 180 days. The purpose of the page is to allow you to look for specific terms, locations, etc.
To provide the greatest flexibility in searching, a whole pane is available for filters (in grey). Once you have finished choosing your filters, you can minimize the filter pane by clicking on the arrow next to the filters title.
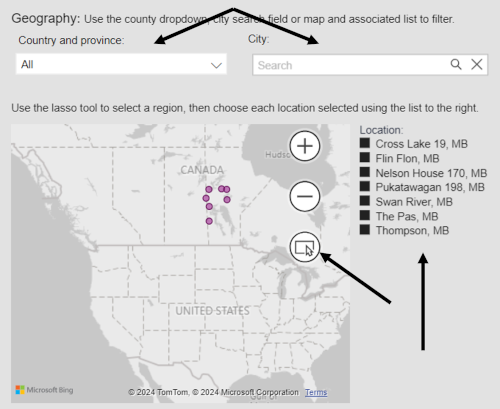
At the top left are the normal date range and type of article filters. There are multiple ways to filter geography: either by county and province/state using the main dropdown, by specific city/municipality name using the search box or using a combination of the map and list of locations. If you use the rectangular selector on the map (see main geography filter section for instructions), you will then need to choose all the corresponding individual locations on the list to the right of the map.
Free text filters are available for drug properties and drug effects. In addition to the search box, lists of all terms currently in each field are provided for manual selection (or inspiration for search terms to include in the free text search boxes). Any combination of search box/list filters can be used, but only one free text search for a drug property (name, mixed with, form, effect) is possible.
All filters on the page are interactive (i.e., when you choose an option on one filter the options available on other filters will update). The number of articles meeting the current filter criteria are shown at the top.

The table showing the list of articles contains all the original and extracted fields:
- The date the article was identified by GDELT (this may not be the date the article was originally posted).
- The original title of the article.
- A link to the original article.
- A list of any locations mentioned in the article (reported as city, province/state).*
- A few word description of the drug event(s) with any information about the impacted population provided in brackets.*
- The drug name.*
- Any other drugs or contaminants the drug may have been mixed with.*
- The form of the drug (e.g., pill, powder).*
- The effect of the drug.*
- The appearance of the drug (e.g., its colour, any symbols or writing).*
- Any information about the prevalence of the drug.*
- The quantity of the drug seized (often in weight or number of pills).*
*Indicates fields that are extracted by AI from the article. These fields (excluding location) may be blank if it is not available in the article or if the AI model fails to extract it.
Information about multiple drugs confiscated may be extracted from each article – in this case each drug will have its own line in the table (starting with drug name).
You can return to the filters pane by clicking the arrow next to the filters title again. The fields that currently have filters on them are shown on the minimized filters pane.
